Outliers are simply data points that are drastically different or distant from other data points. These are data points that are exceptionally different from the norm and can have a substantial impact on statistical analysis, machine learning models, and data-driven decision-making. Outliers are also sometimes called anomalies or extreme values.
Checking for outliers
We have a number of ways to check for outliers such as;
Visual Inspection:
- Box Plots: Box plots are effective for visualizing the distribution of data and identifying outliers. Data points that fall outside the "whiskers" of the box plot are typically considered outliers.
- Scatter Plots: Scatter plots can help identify outliers by visually inspecting data points that deviate significantly from the overall pattern of the data.
Statistical Methods:
- Z-Score: Calculate the Z-score for each data point. Data points with Z-scores greater than a threshold (e.g., 2 or 3) are considered outliers. The Z-score measures how many standard deviations a data point is away from the mean.
- IQR (Interquartile Range): Calculate the interquartile range, which is the difference between the 75th percentile (Q3) and the 25th percentile (Q1). Data points outside the range
[Q1 - 1.5 * IQR, Q3 + 1.5 * IQR]are considered outliers. - We used the constant 1.5 is used in outlier detection due to its statistical basis in the interquartile range method, providing a balanced, robust, and widely accepted standard for identifying outliers in various types of data distributions, assuming a normal distribution where it effectively covers approximately 99.3% of the data.
Boxplots are often preferred for outlier detection due to their simplicity, clear outlier identification, robustness to skewed data, standardized definition of outliers, suitability for group comparisons, and compatibility with other visualization methods. However, in complex data situations, alternative techniques may be necessary, and the choice of method should align with specific dataset characteristics and analysis objectives.
Visualization of outliers in numeric data
xxxxxxxxxxdata_cleaner.outliers()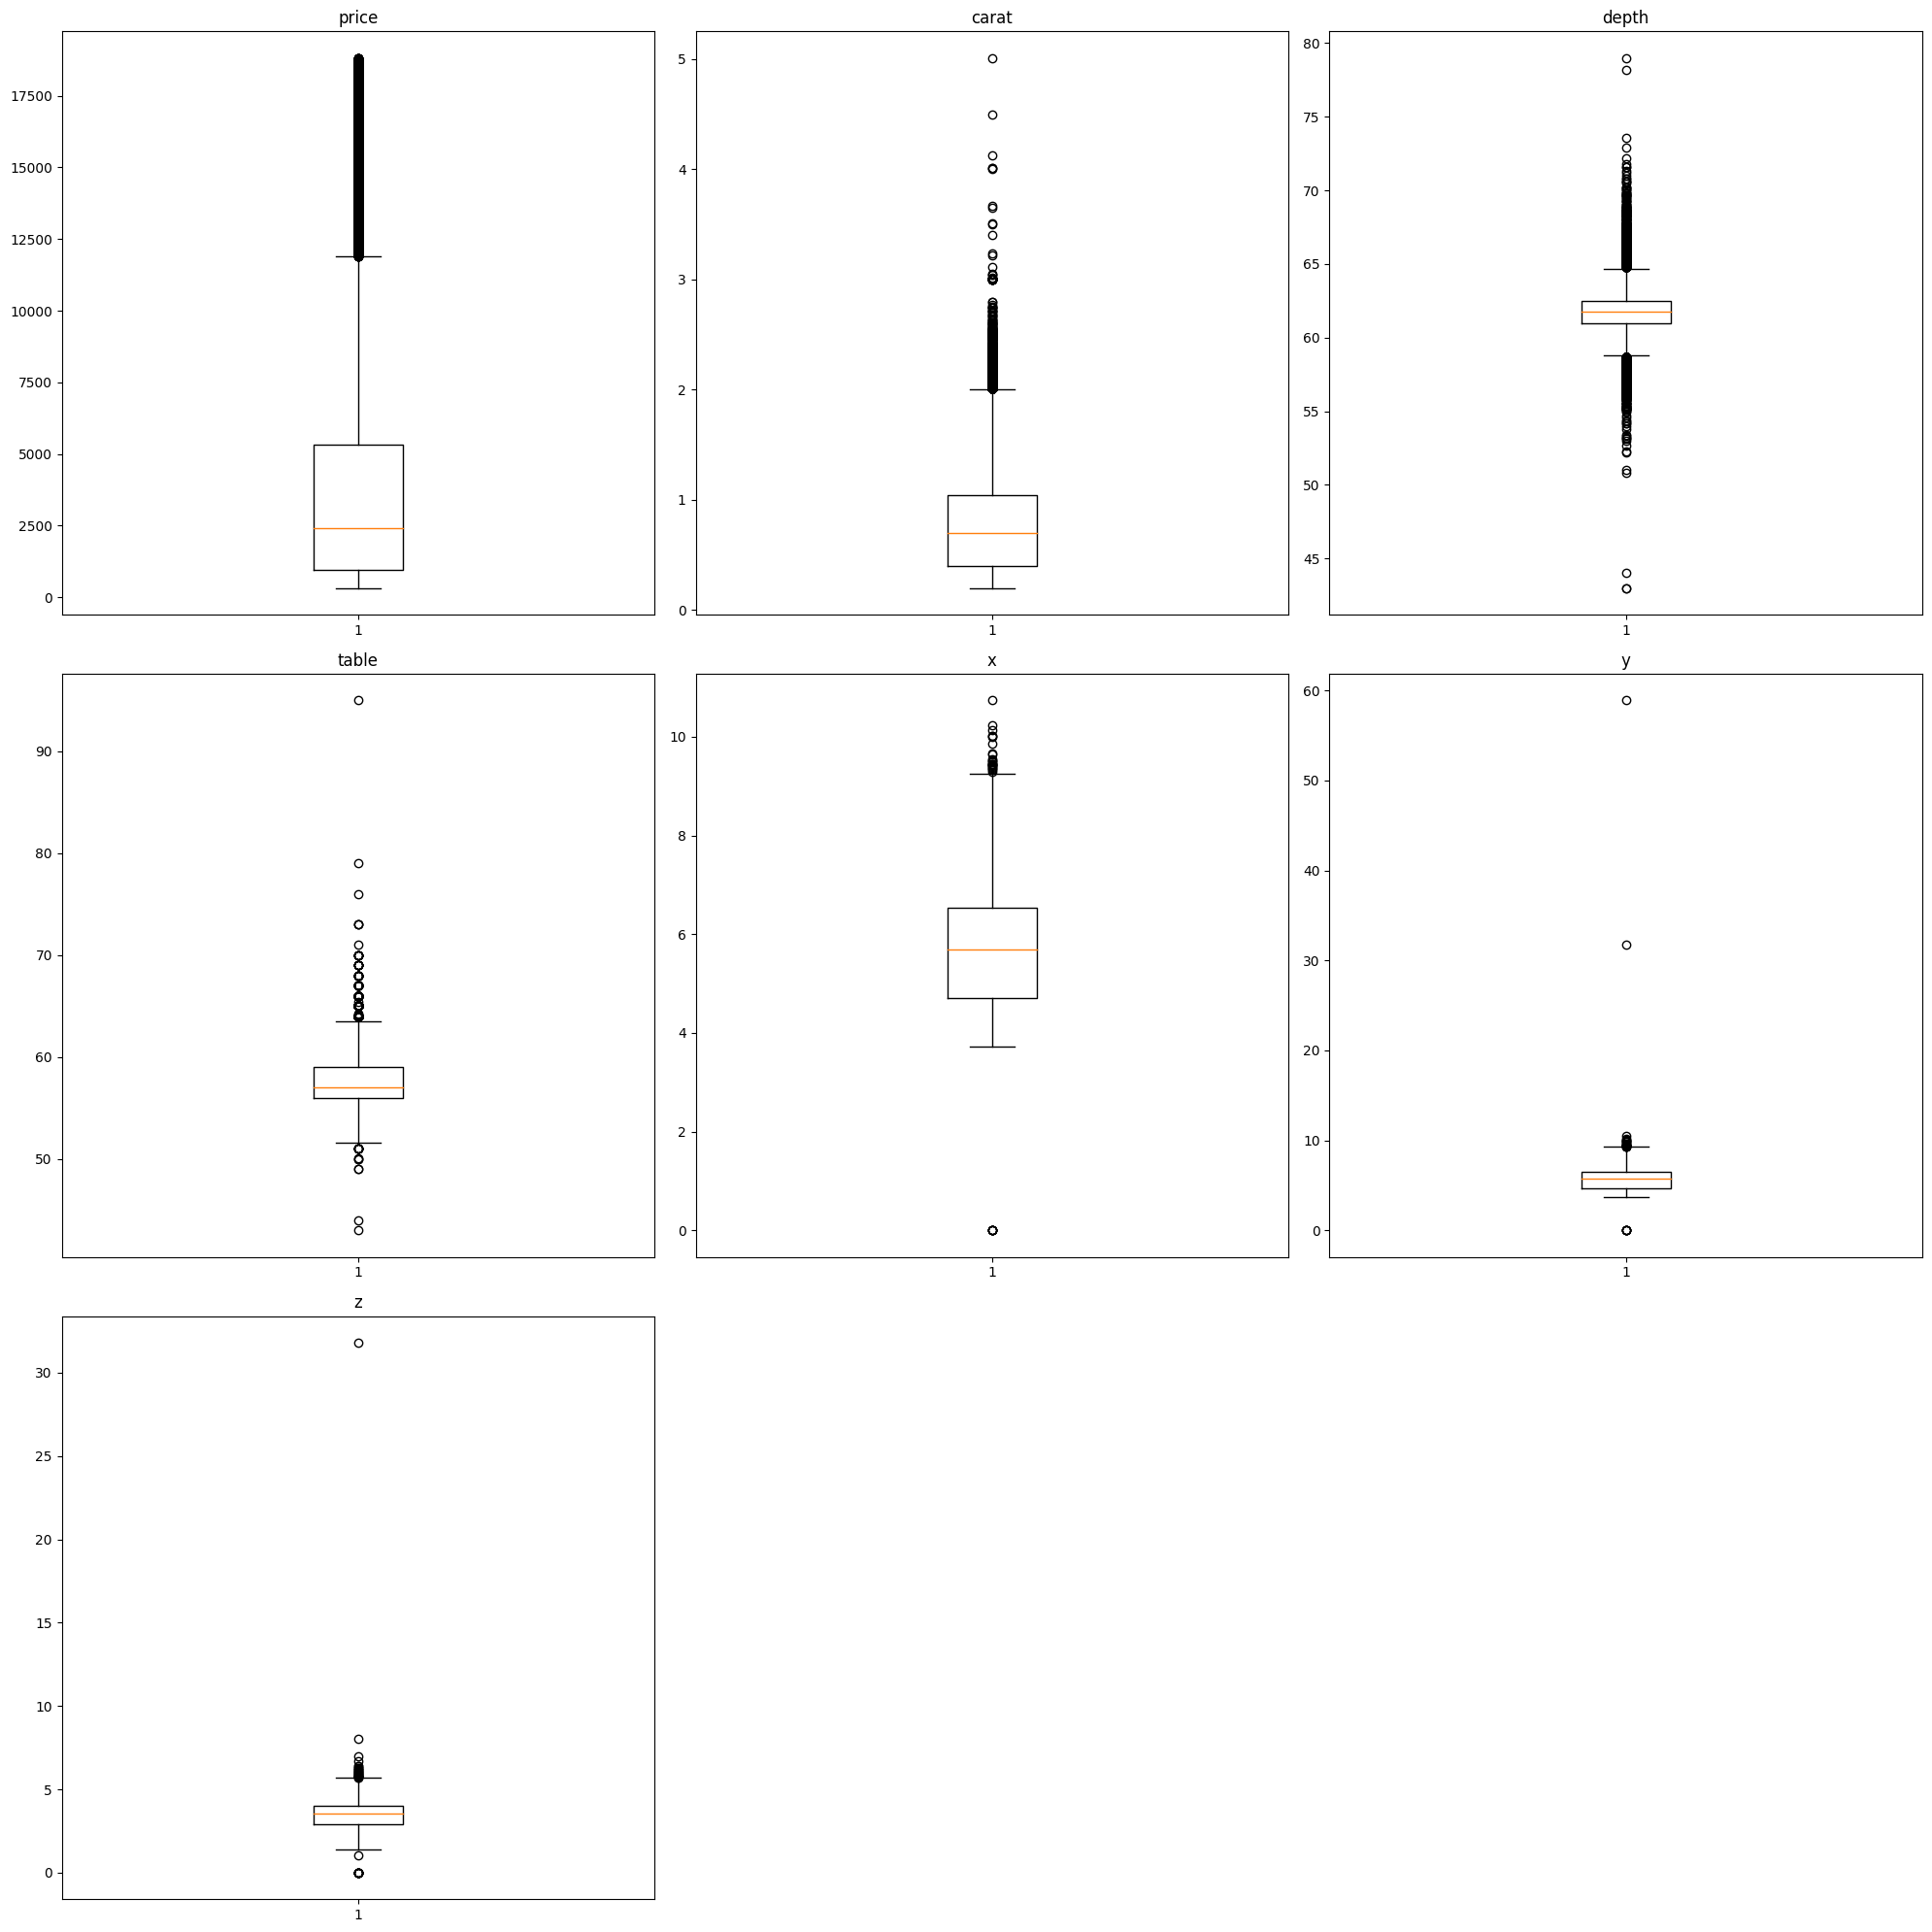
Removing outliers
Removing outliers from a dataset is a crucial step in data preprocessing to ensure the accuracy and reliability of statistical analyses and machine learning models. We used the Interquartile Range (IQR) method to remove the outliers in our dataset. By removing outliers using the IQR method, you can mitigate the influence of extreme values that can skew the results of statistical analyses or adversely affect the performance of machine learning algorithms
xxxxxxxxxxdata_cleaner.remove_outliers()Visualization after removing outliers in numeric data
xxxxxxxxxxdata_cleaner.outliers()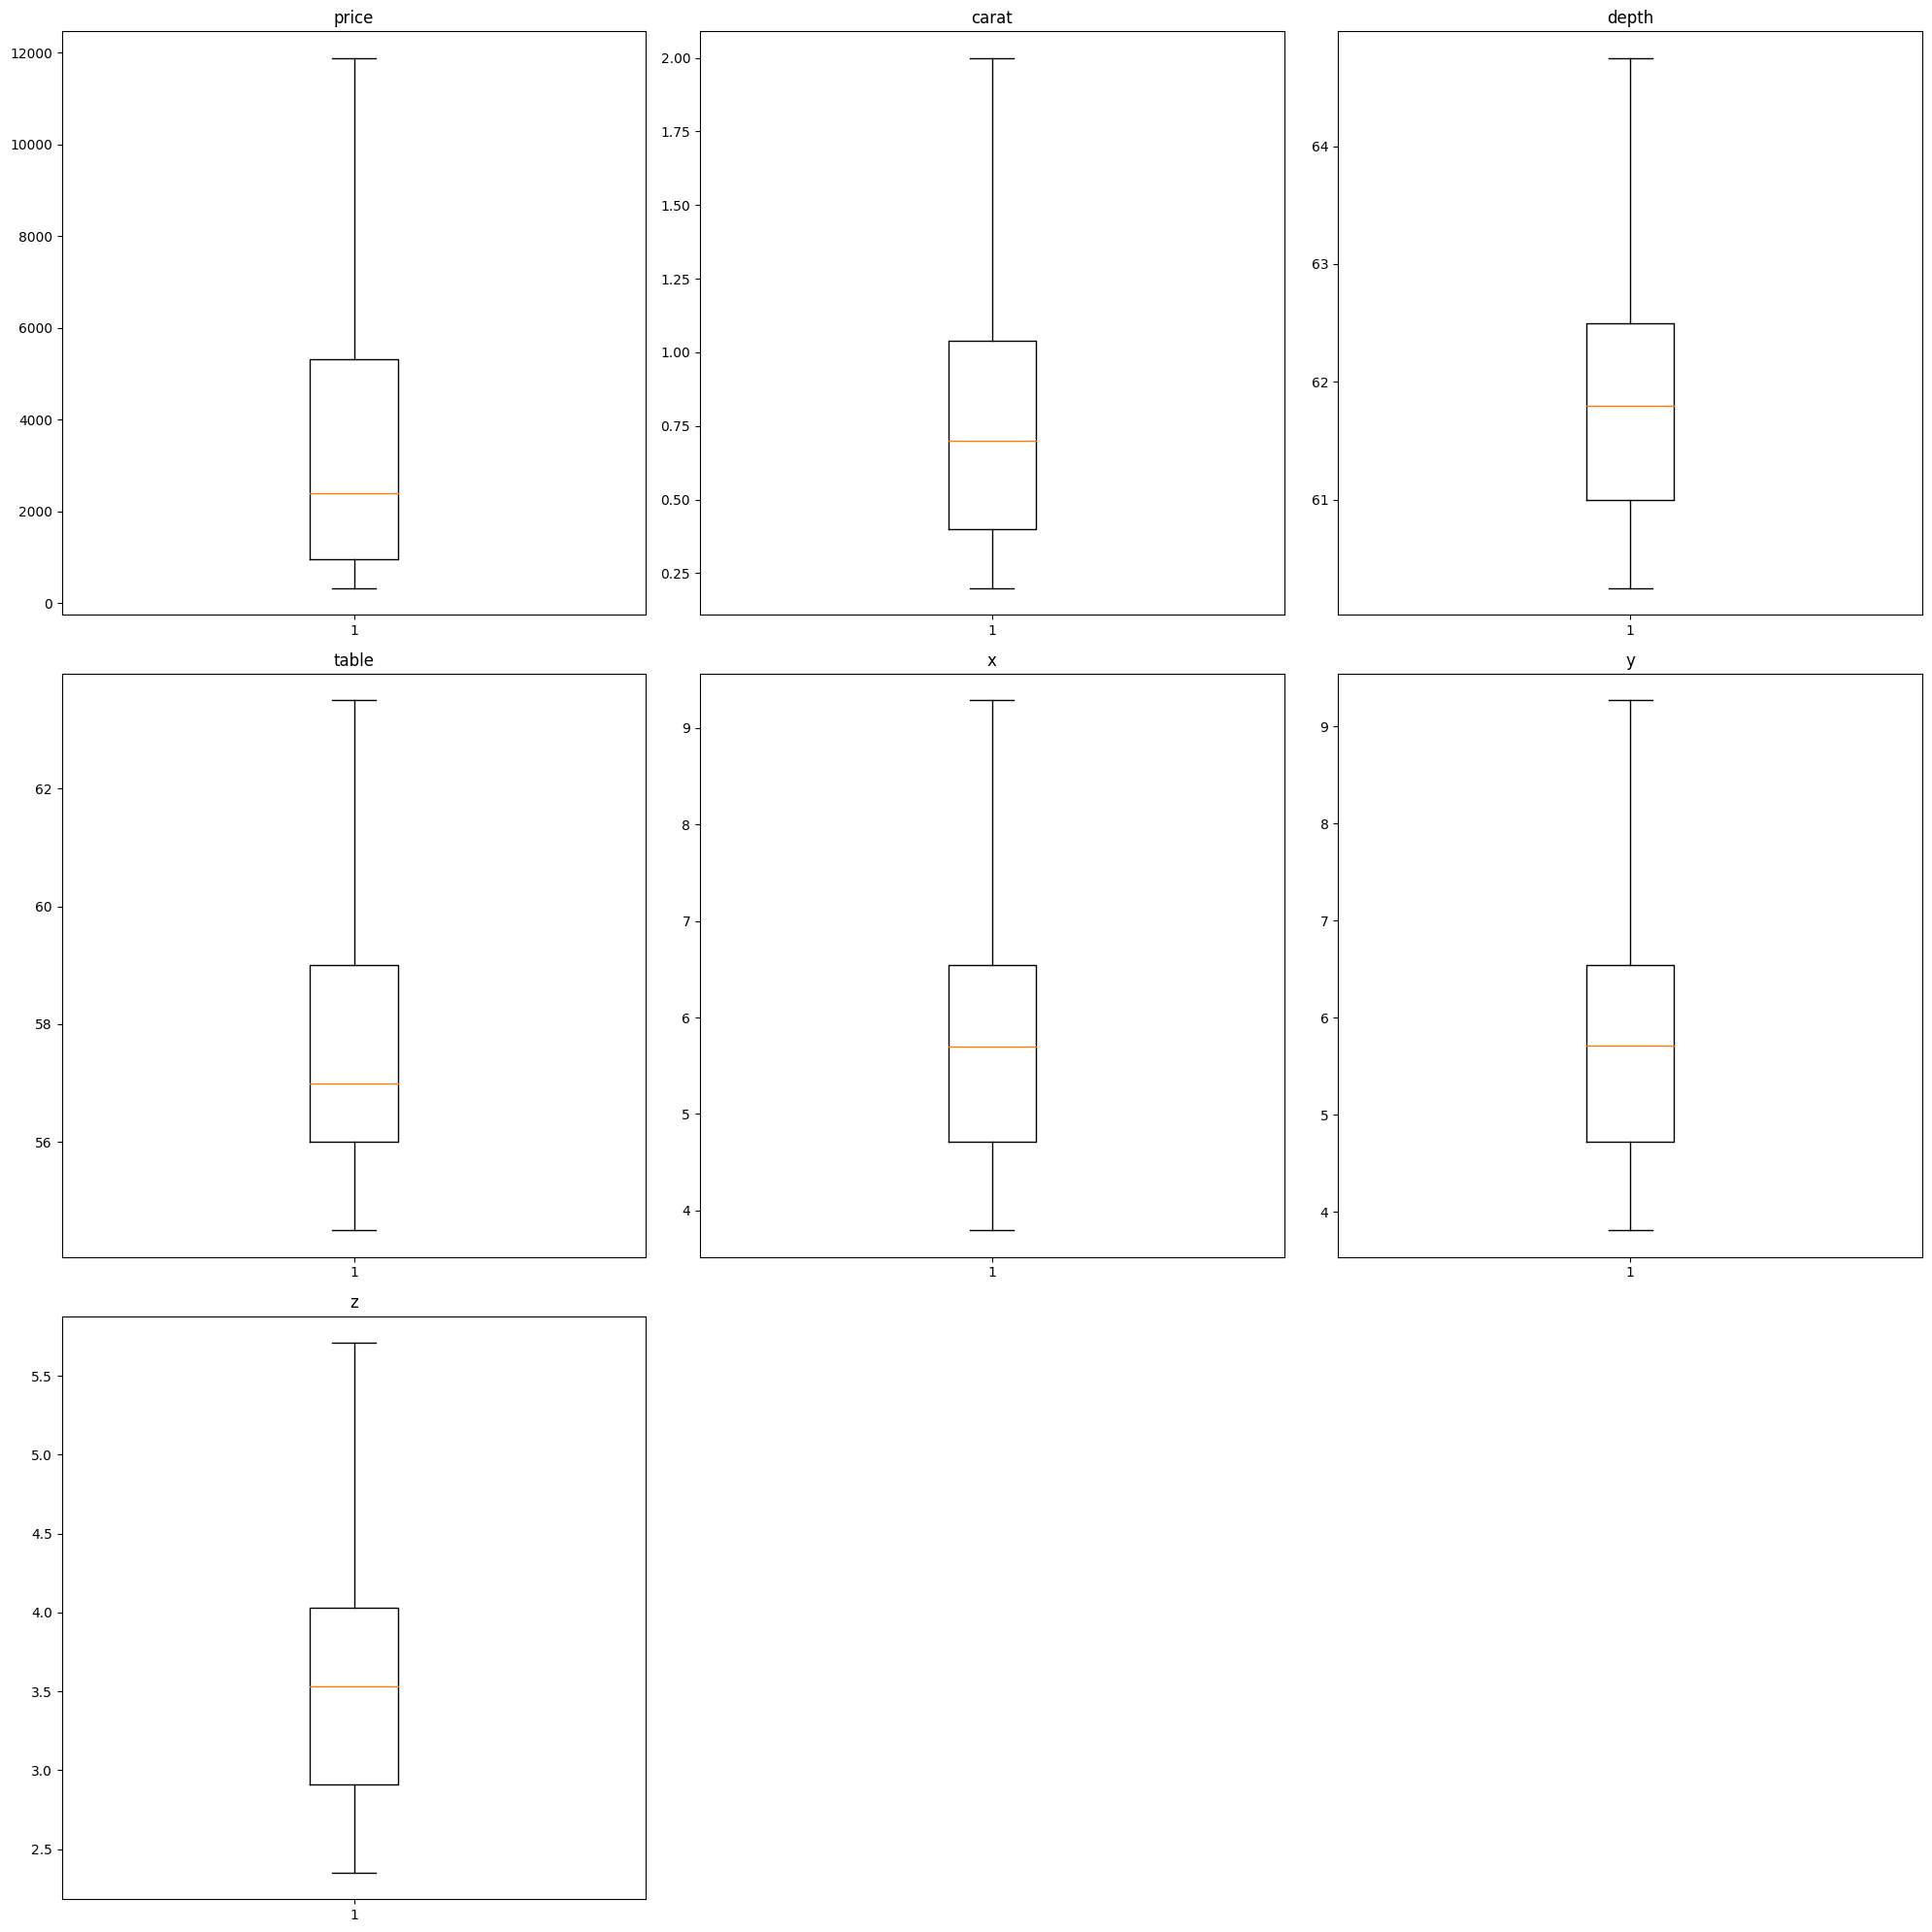
On the other hand, we may find out that some of the features are not having outliers and we may want to neglect them and deal with only those that are having outliers, then we can use another function,
For instance it can be a single column or a number of columns, this can be implemented in python,
xxxxxxxxxxdata_cleaner.outliers_single(column= "price") # Customise to column name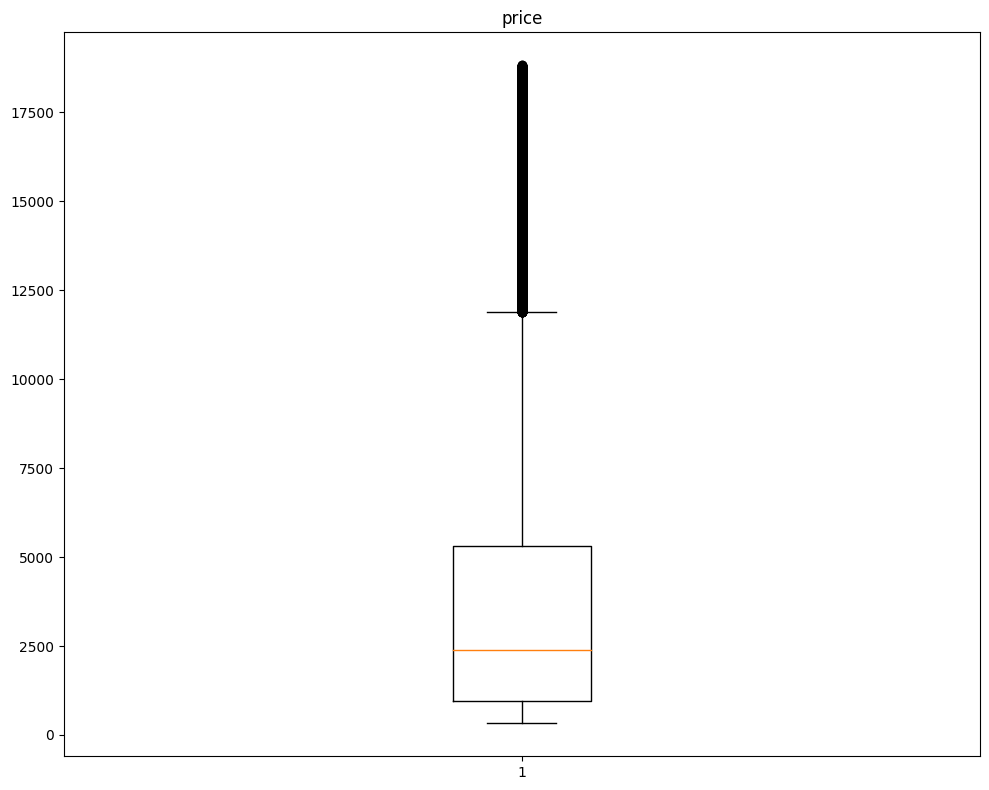
Removing Outliers
xxxxxxxxxxdata_cleaner.remove_outliers_single(column="price")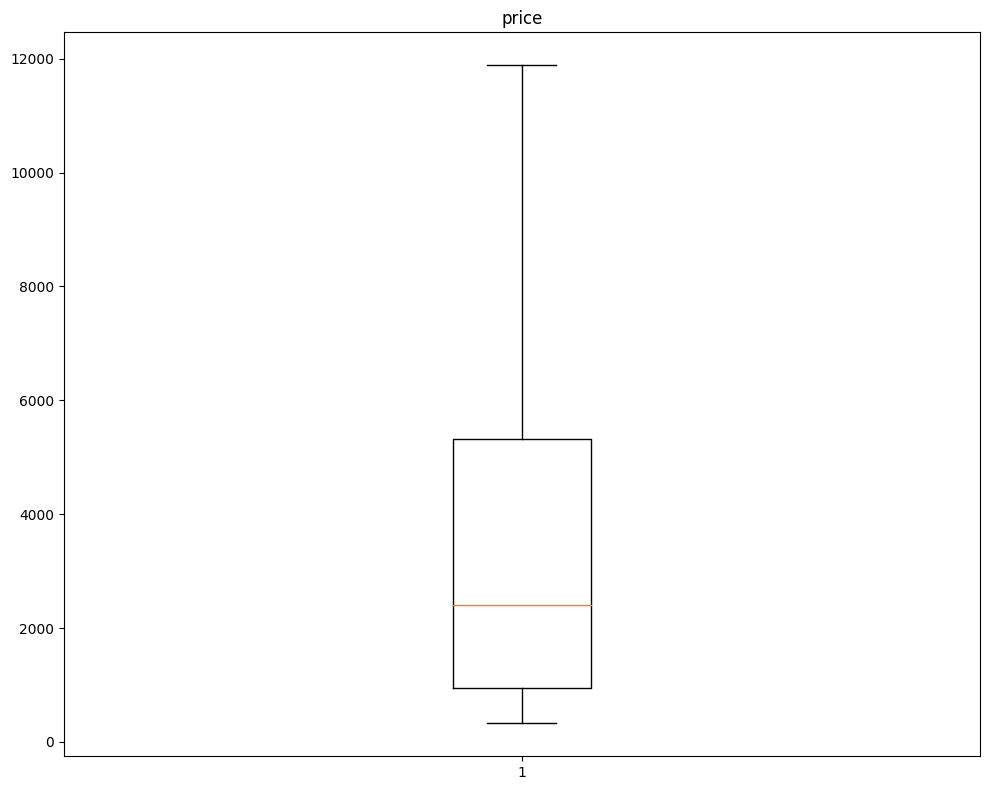
For two or more (multi) columns
xxxxxxxxxxdata_cleaner.outliers_single(column= ["x","carat"]) # you can customerise the code according to column names.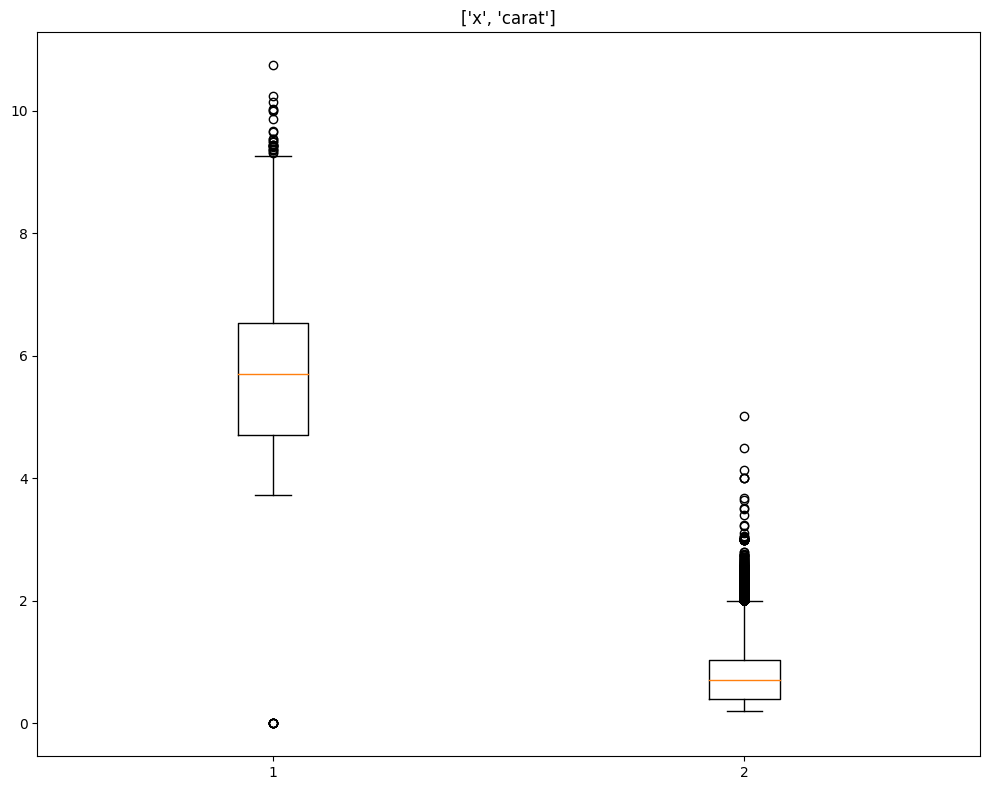
xxxxxxxxxxdata_cleaner.outliers_single(column= ["x","carat"])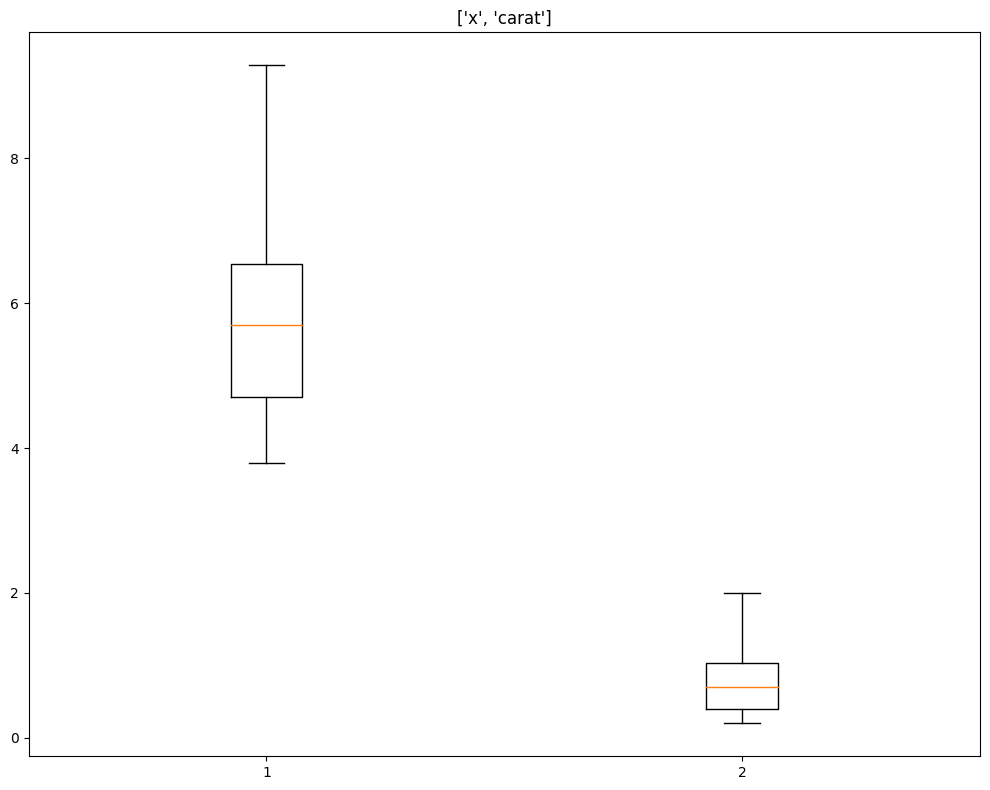
xxxxxxxxxxdata_cleaner.outliers()