We've concentrated on various situations where researchers might aim to discern meaningful associations between categorical and continuous data. In order to cater to different data configurations, we've formulated methods to evaluate relationships between categorical vs. categorical, categorical vs. continuous, continuous vs. categorical, and continuous vs. continuous data. Such an all-encompassing strategy facilitates a multifaceted and in-depth examination of correlations. This ensures that our analytical techniques are flexible enough to address a broad spectrum of data formats and investigative requirements.
Continuous vs. continuous data
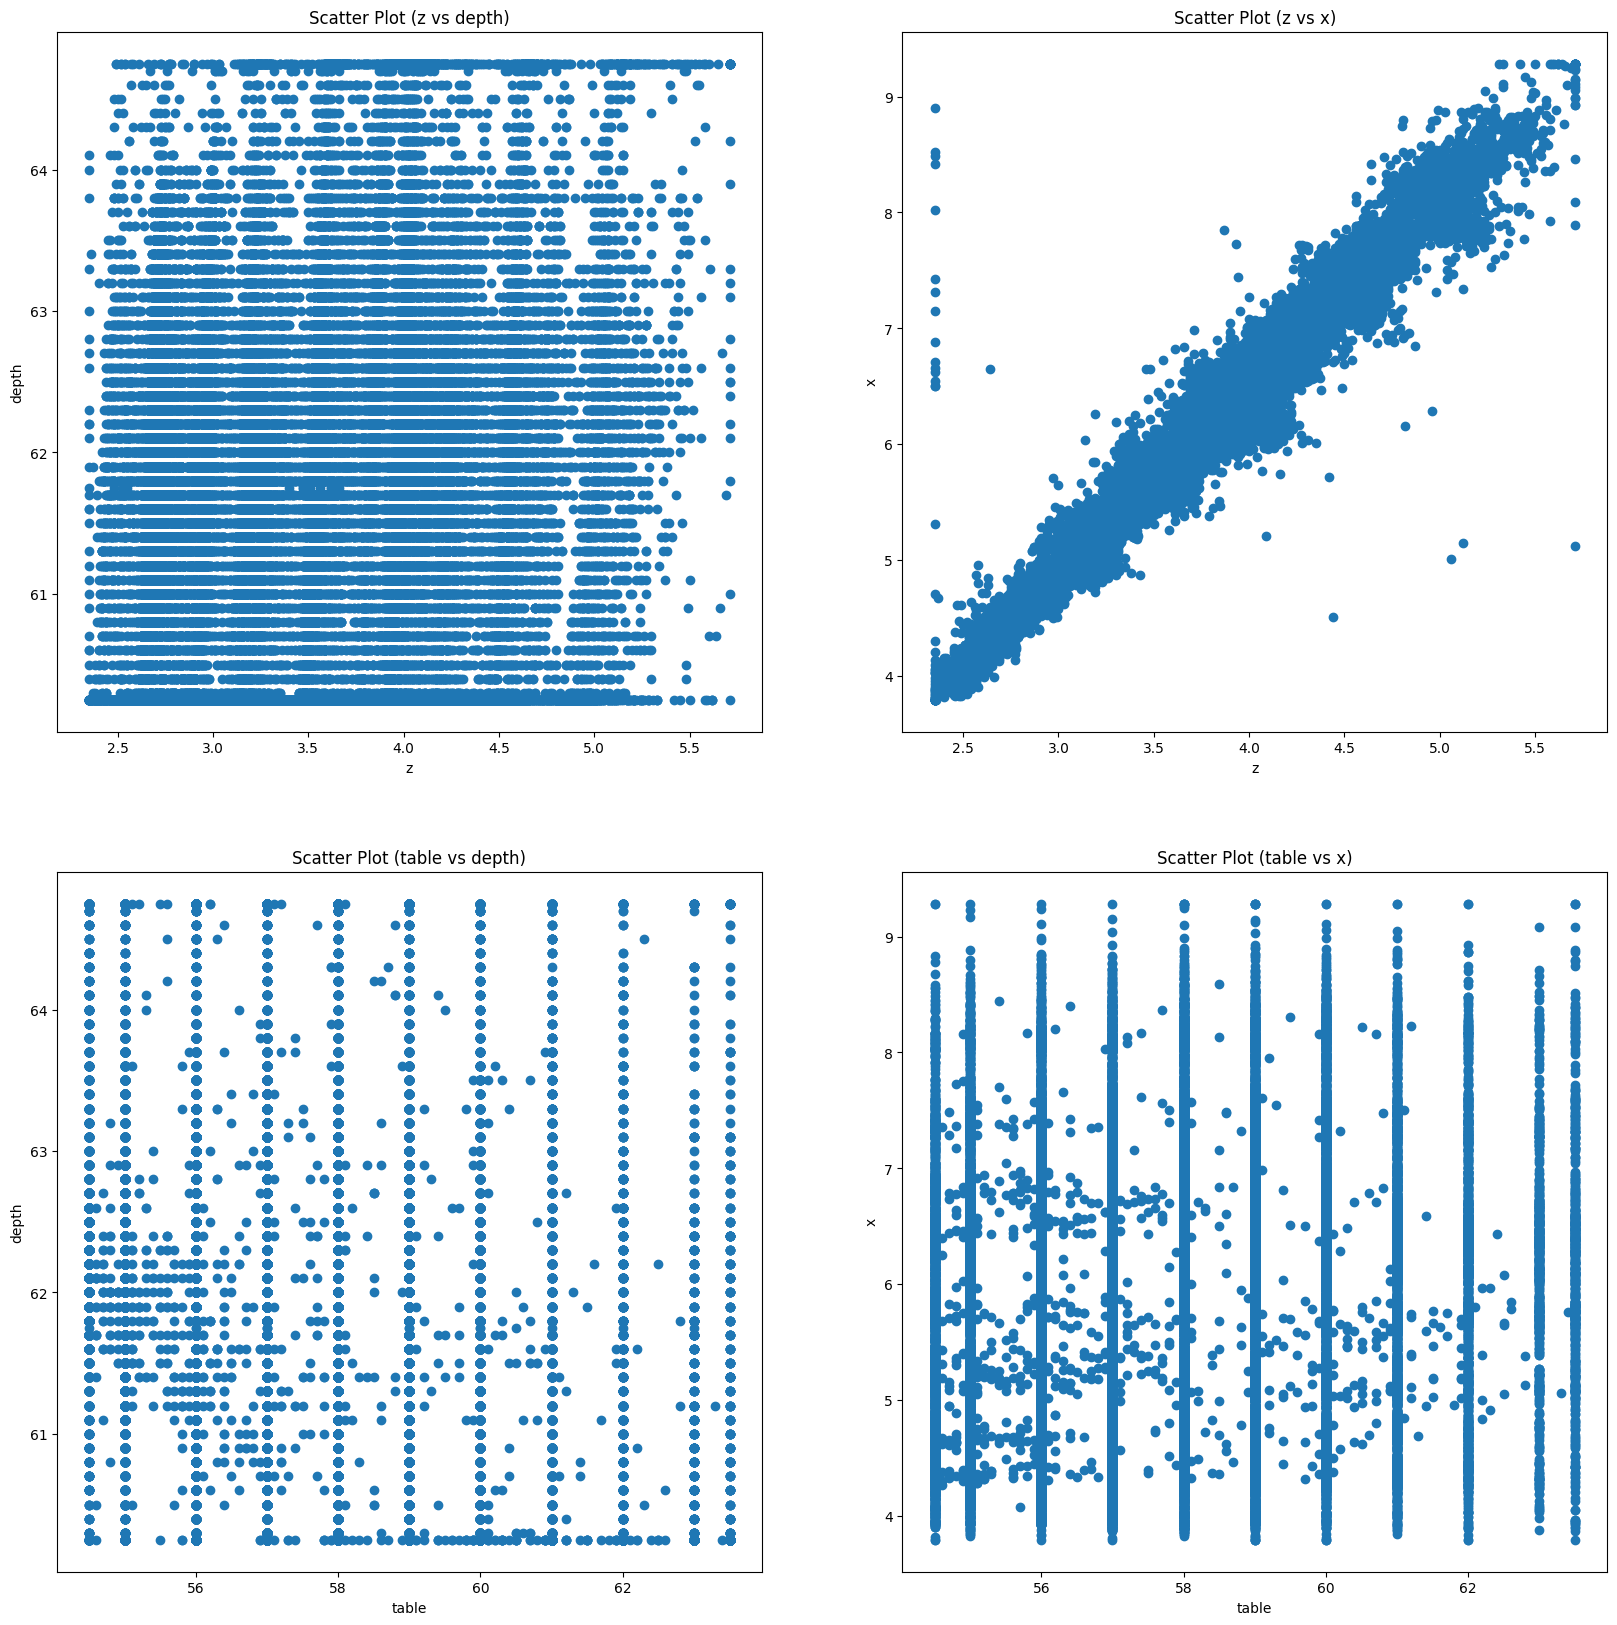
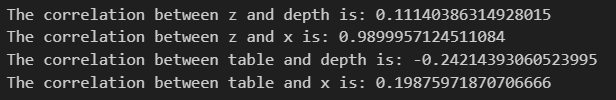
xxxxxxxxxxdata_cleaner.cont_to_cont("price","carat")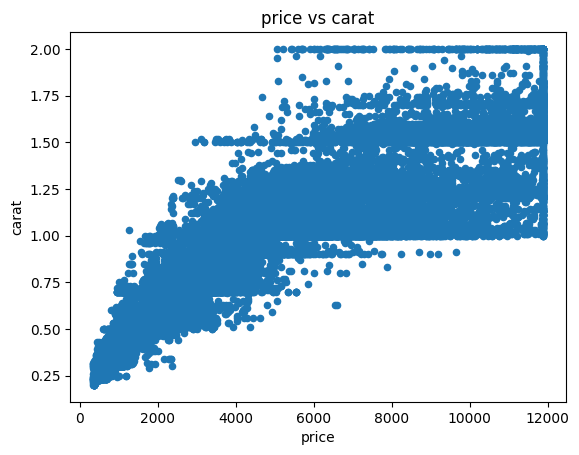

xxxxxxxxxxdata_cleaner.cont_to_cont("price","carat")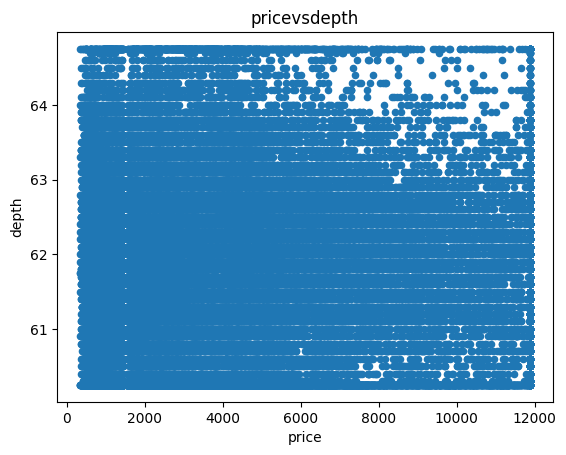

Continuous vs. Categorical data
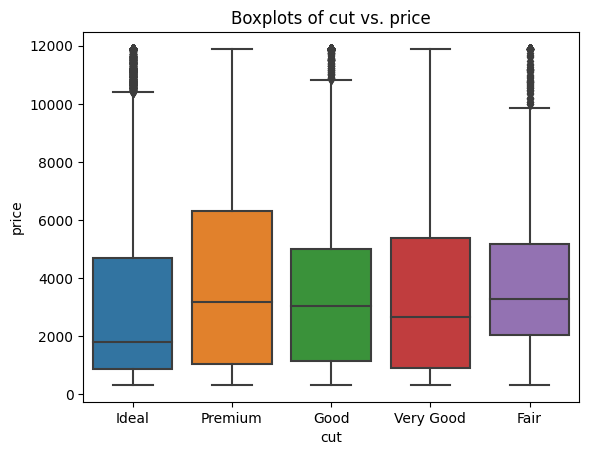
xxxxxxxxxxdata_cleaner.cont_to_cat("cut", "x")

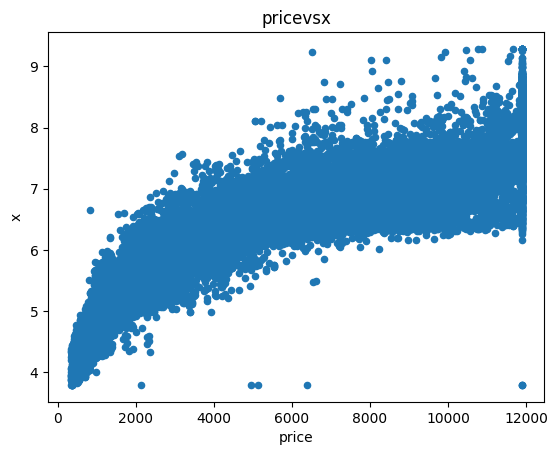
xxxxxxxxxxdatacleaner.cont to_cat("price", ["clarity", "cut"])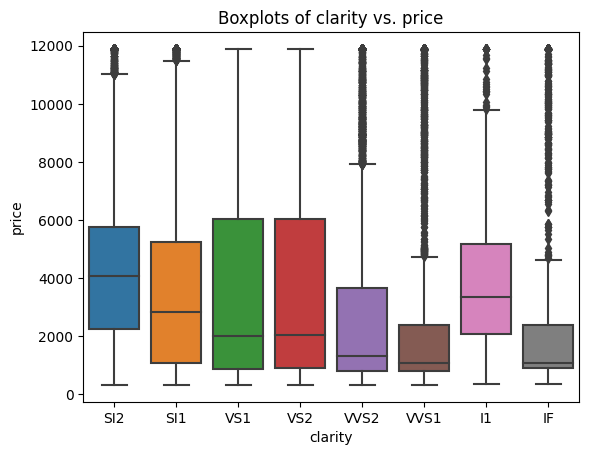


xxxxxxxxxxdata_cleaner.cont_to_cat(["x","price"], ["clarity", "cut"])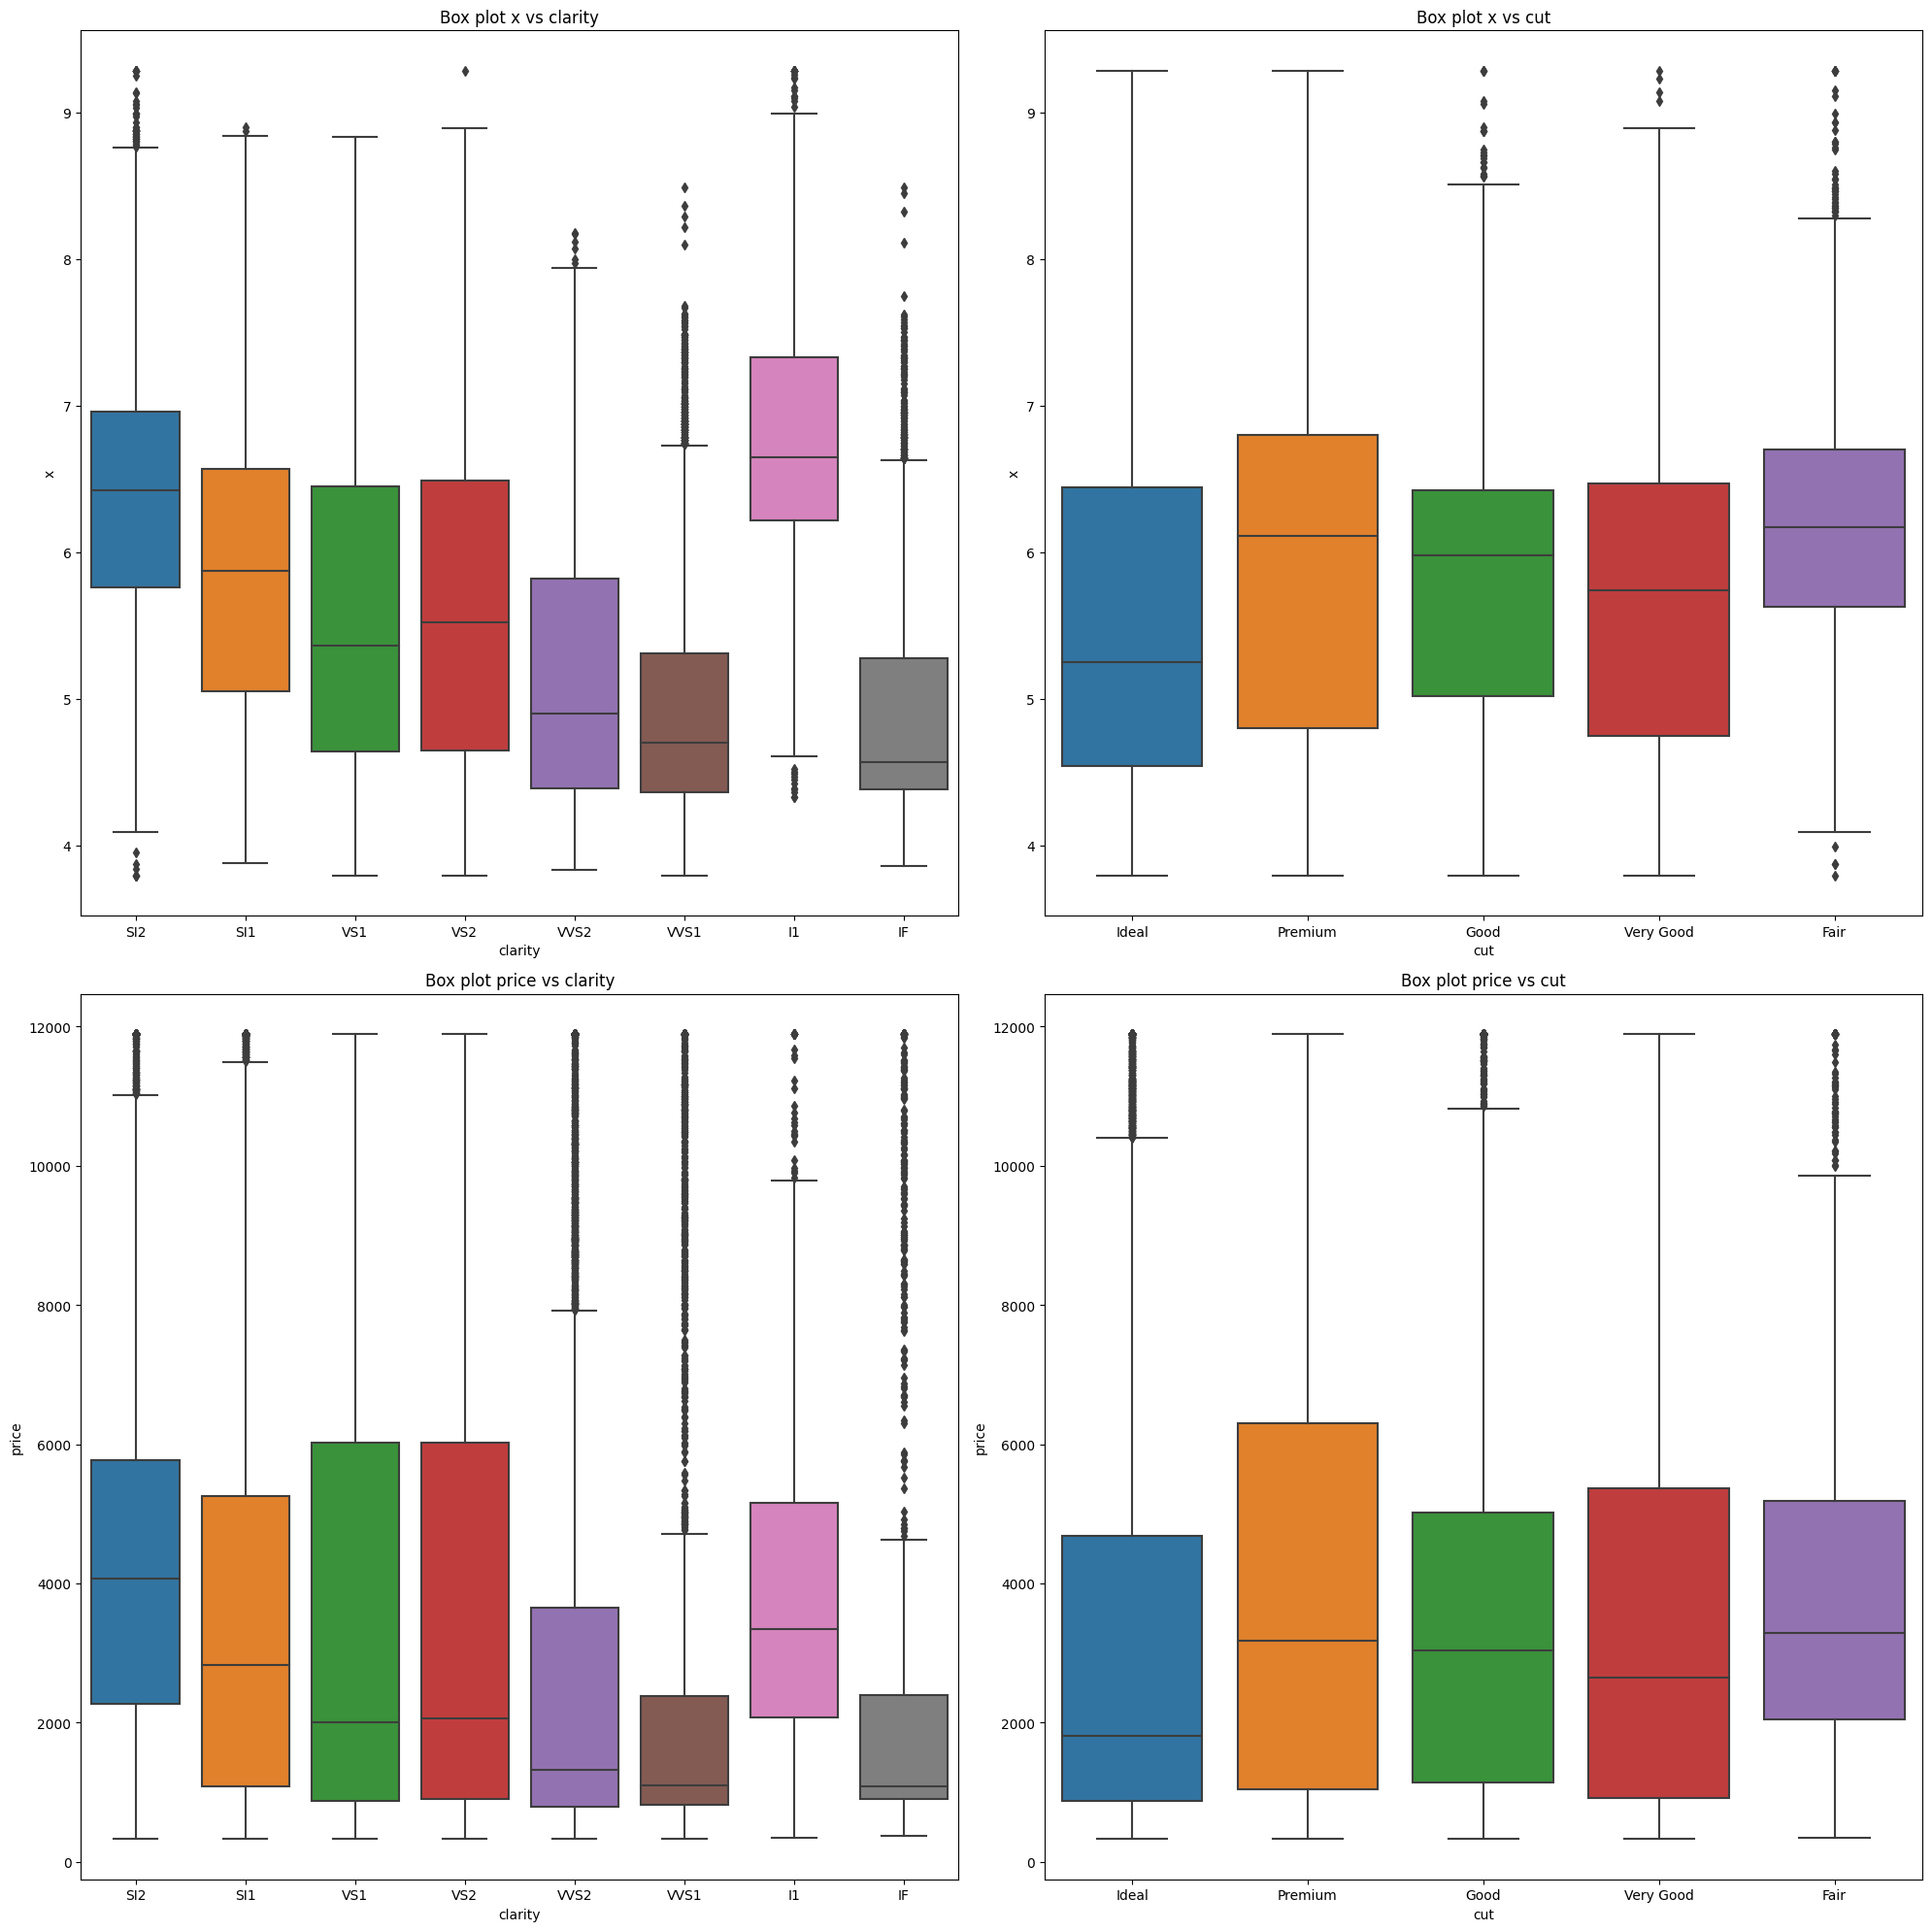

Categorical vs. Categorical data
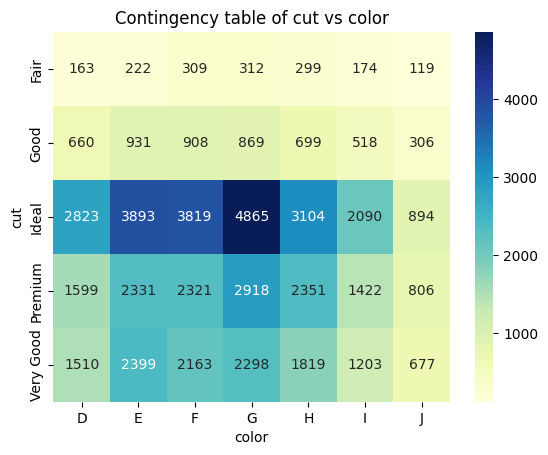
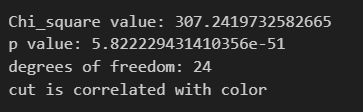
xxxxxxxxxxdata_cleaner.cat_to_cat("cut", "color")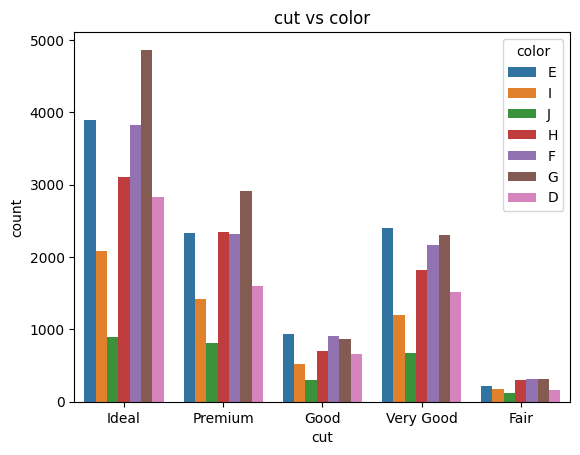
The remaining approaches are ;
xxxxxxxxxxdata_cleaner.cat_to_cat("cut", ["clarity", "color"])xxxxxxxxxxdata_cleaner.cat_to_cat(["cut"], ["clarity", "color"])Line plots.
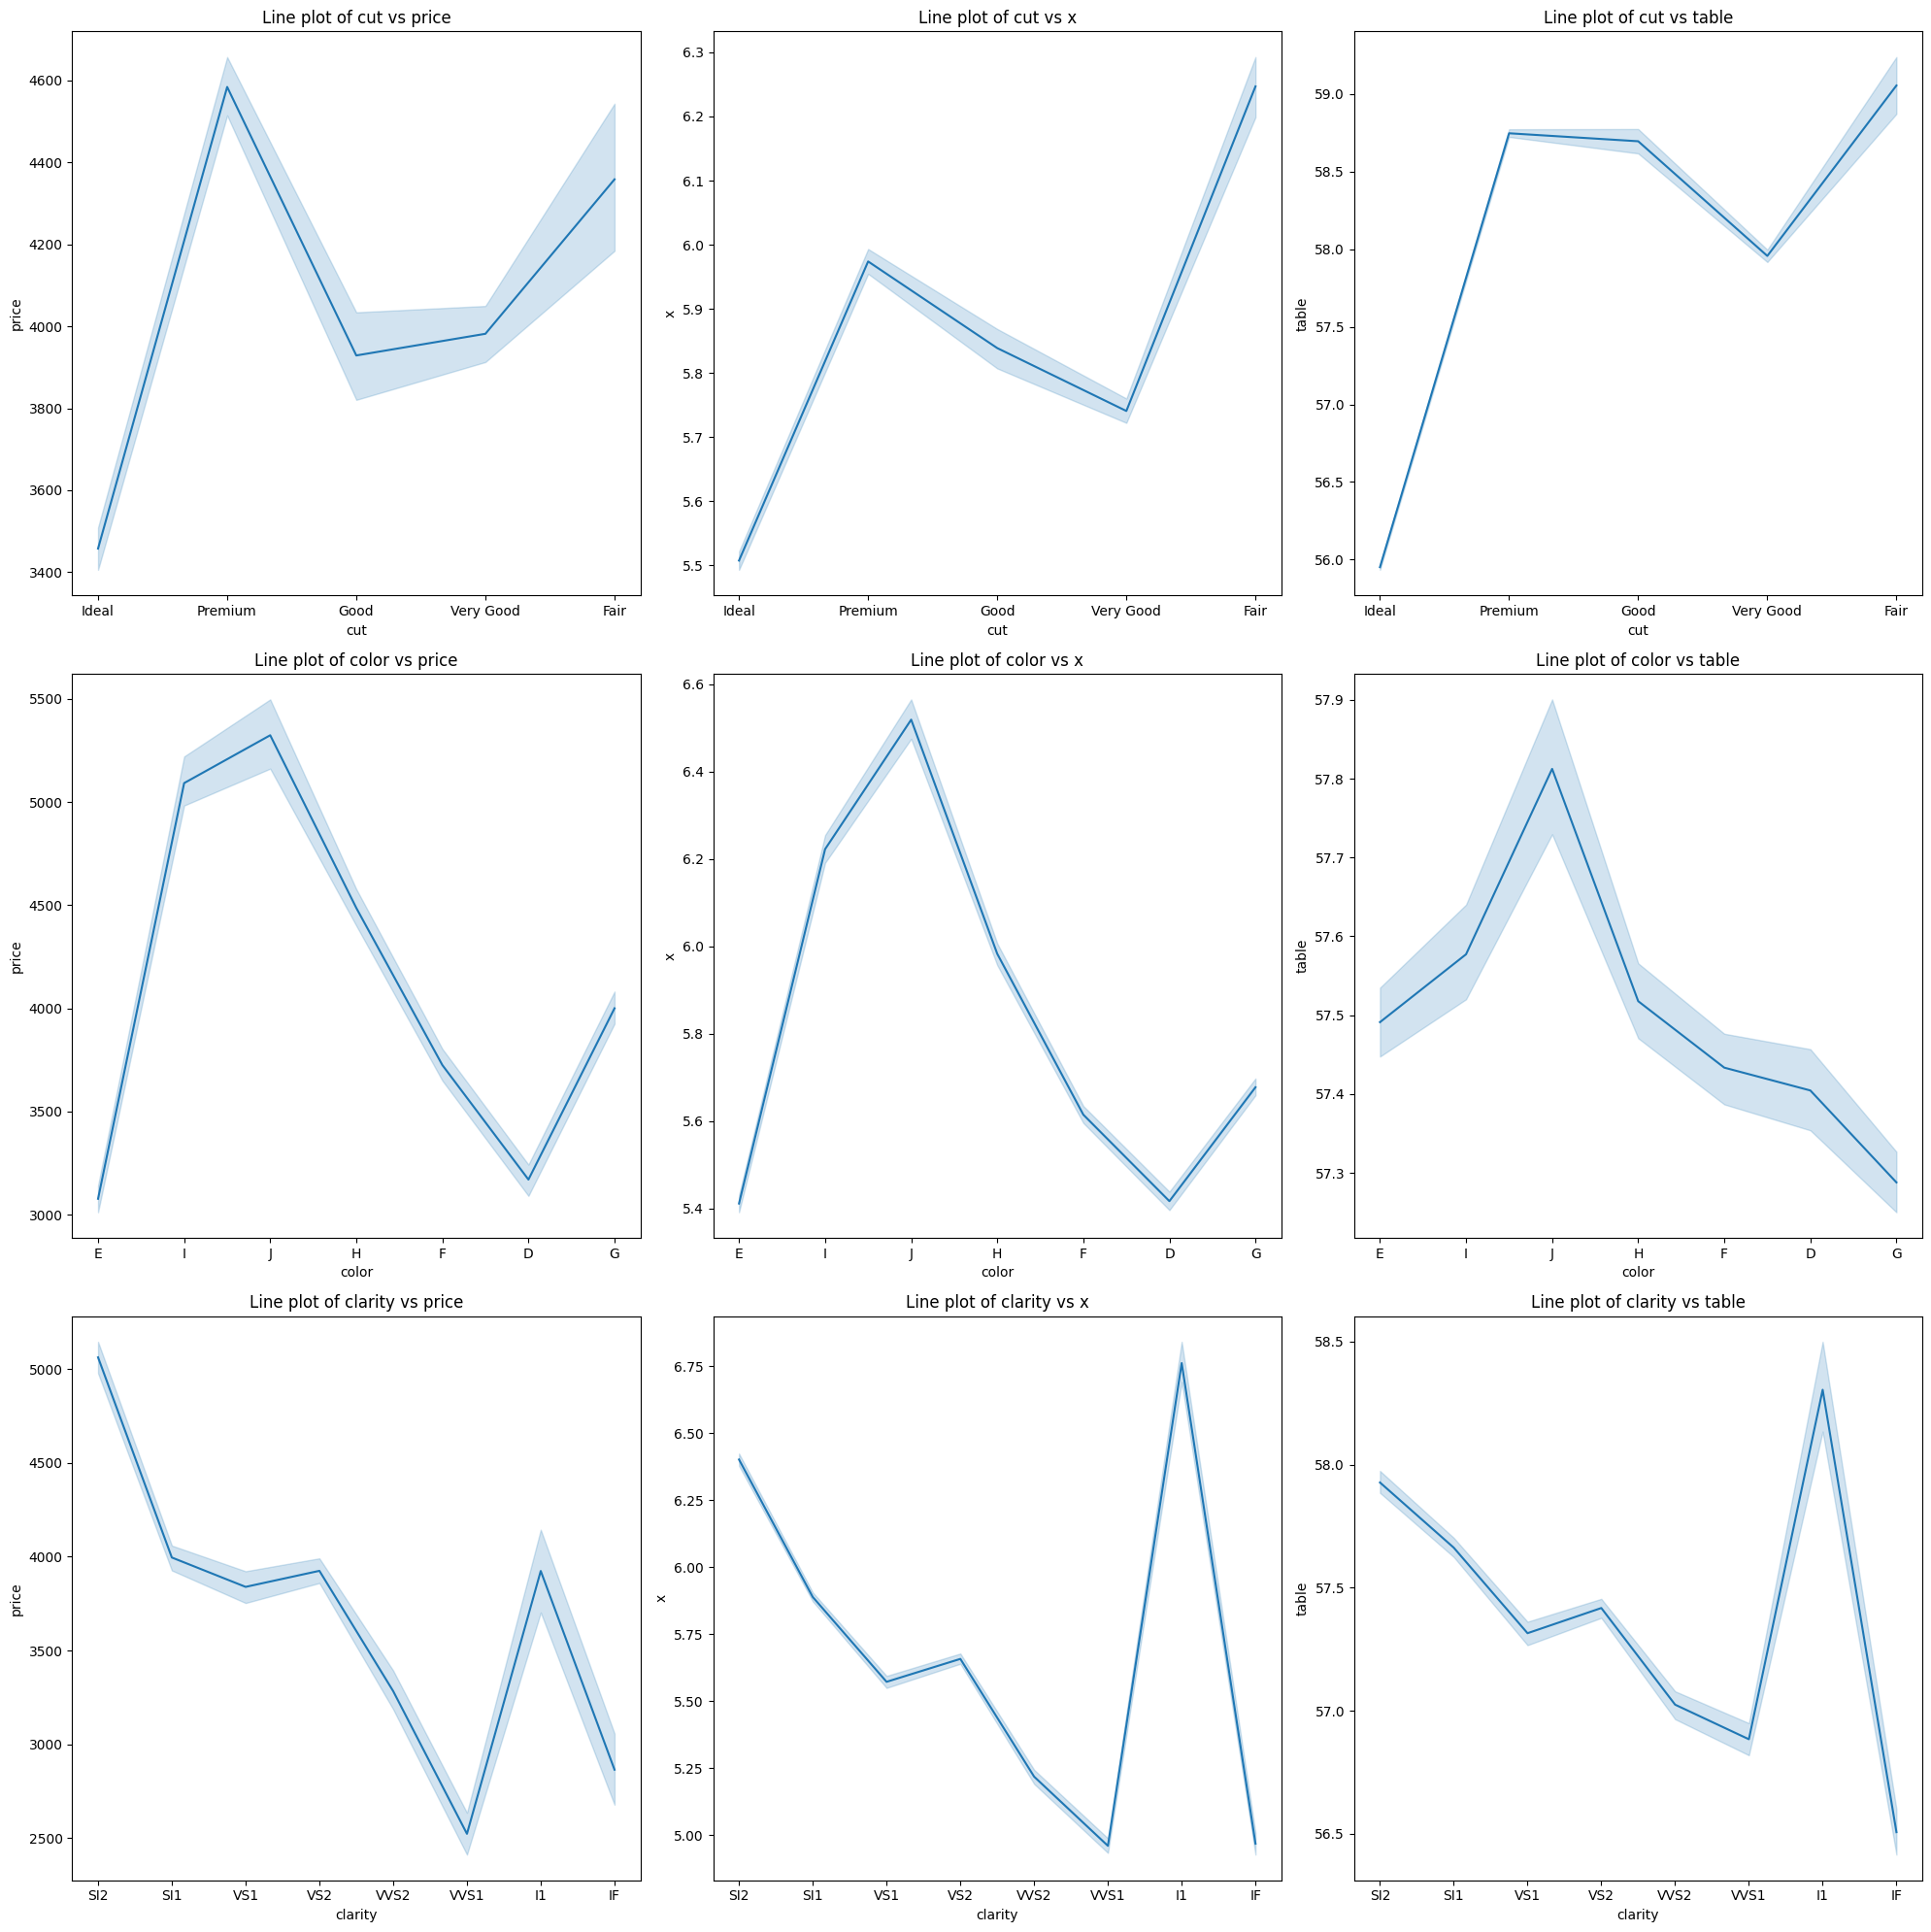
Line plots play an indispensable role by visually representing trends, patterns, and fluctuations in data over a continuous interval or time period. They offer an intuitive snapshot of data evolution, enabling researchers to quickly discern temporal relationships, detect anomalies, and gauge the overall trajectory of datasets, making them invaluable for time series analysis, monitoring changes, and predictive modeling.
These can be done in the same approaches as shown above, we can us an example of the lists entered as parameters.
xxxxxxxxxxdata_cleaner.lineplot(["cut",'color','clarity'],["price","x", 'table'])