Missing values (NA) refers to the absence or lack of information for a particular variable (feature) in a dataset.
They have a number of reasons as to why they occur in our datasets which may include no response in surveys, Data entry errors, data transformation etc.
This can be achieved through
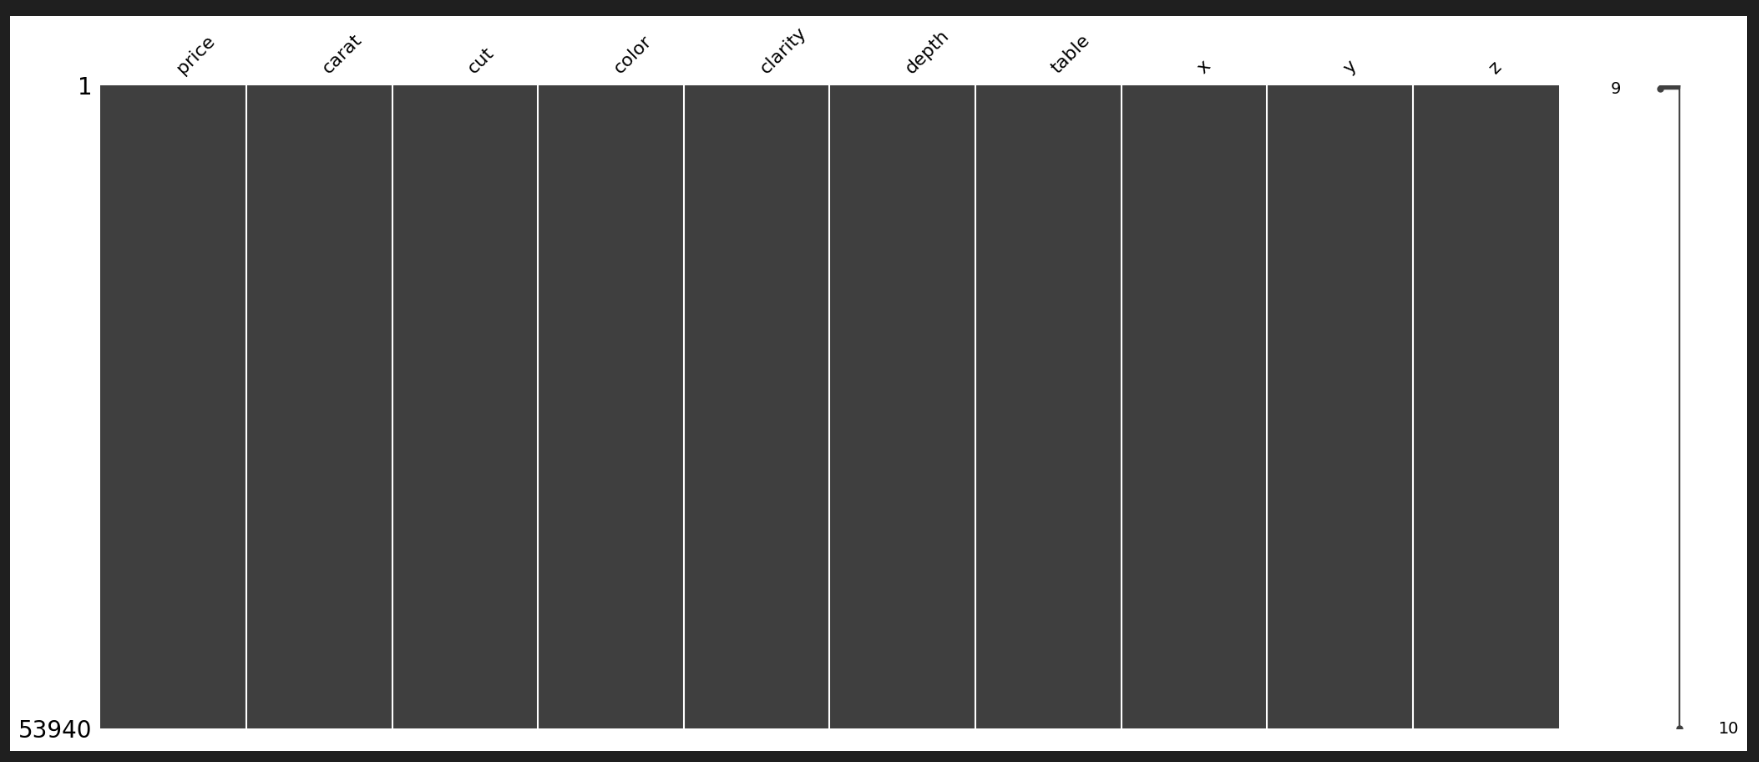
Checking for missing values
xxxxxxxxxxdata_cleaner.missing_values()The output is a dataframe containing two columns, feature names and the number of NA values and a plot that indicates white spaces for missing values in the data.
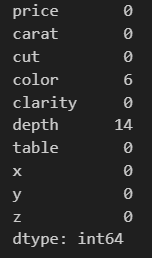
Additionally, we can also check missing values for a specific column (feature) for example if we want to check for the missing data points for price, we can use the code below
xxxxxxxxxxdata_cleaner.col_missing_value("price")Looking at the distribution of the continuous features.
It is always important to study the distribution of the numeric columns so that we can determine whether they are skewed or normally distributed.
xxxxxxxxxxdata_cleaner.distributions()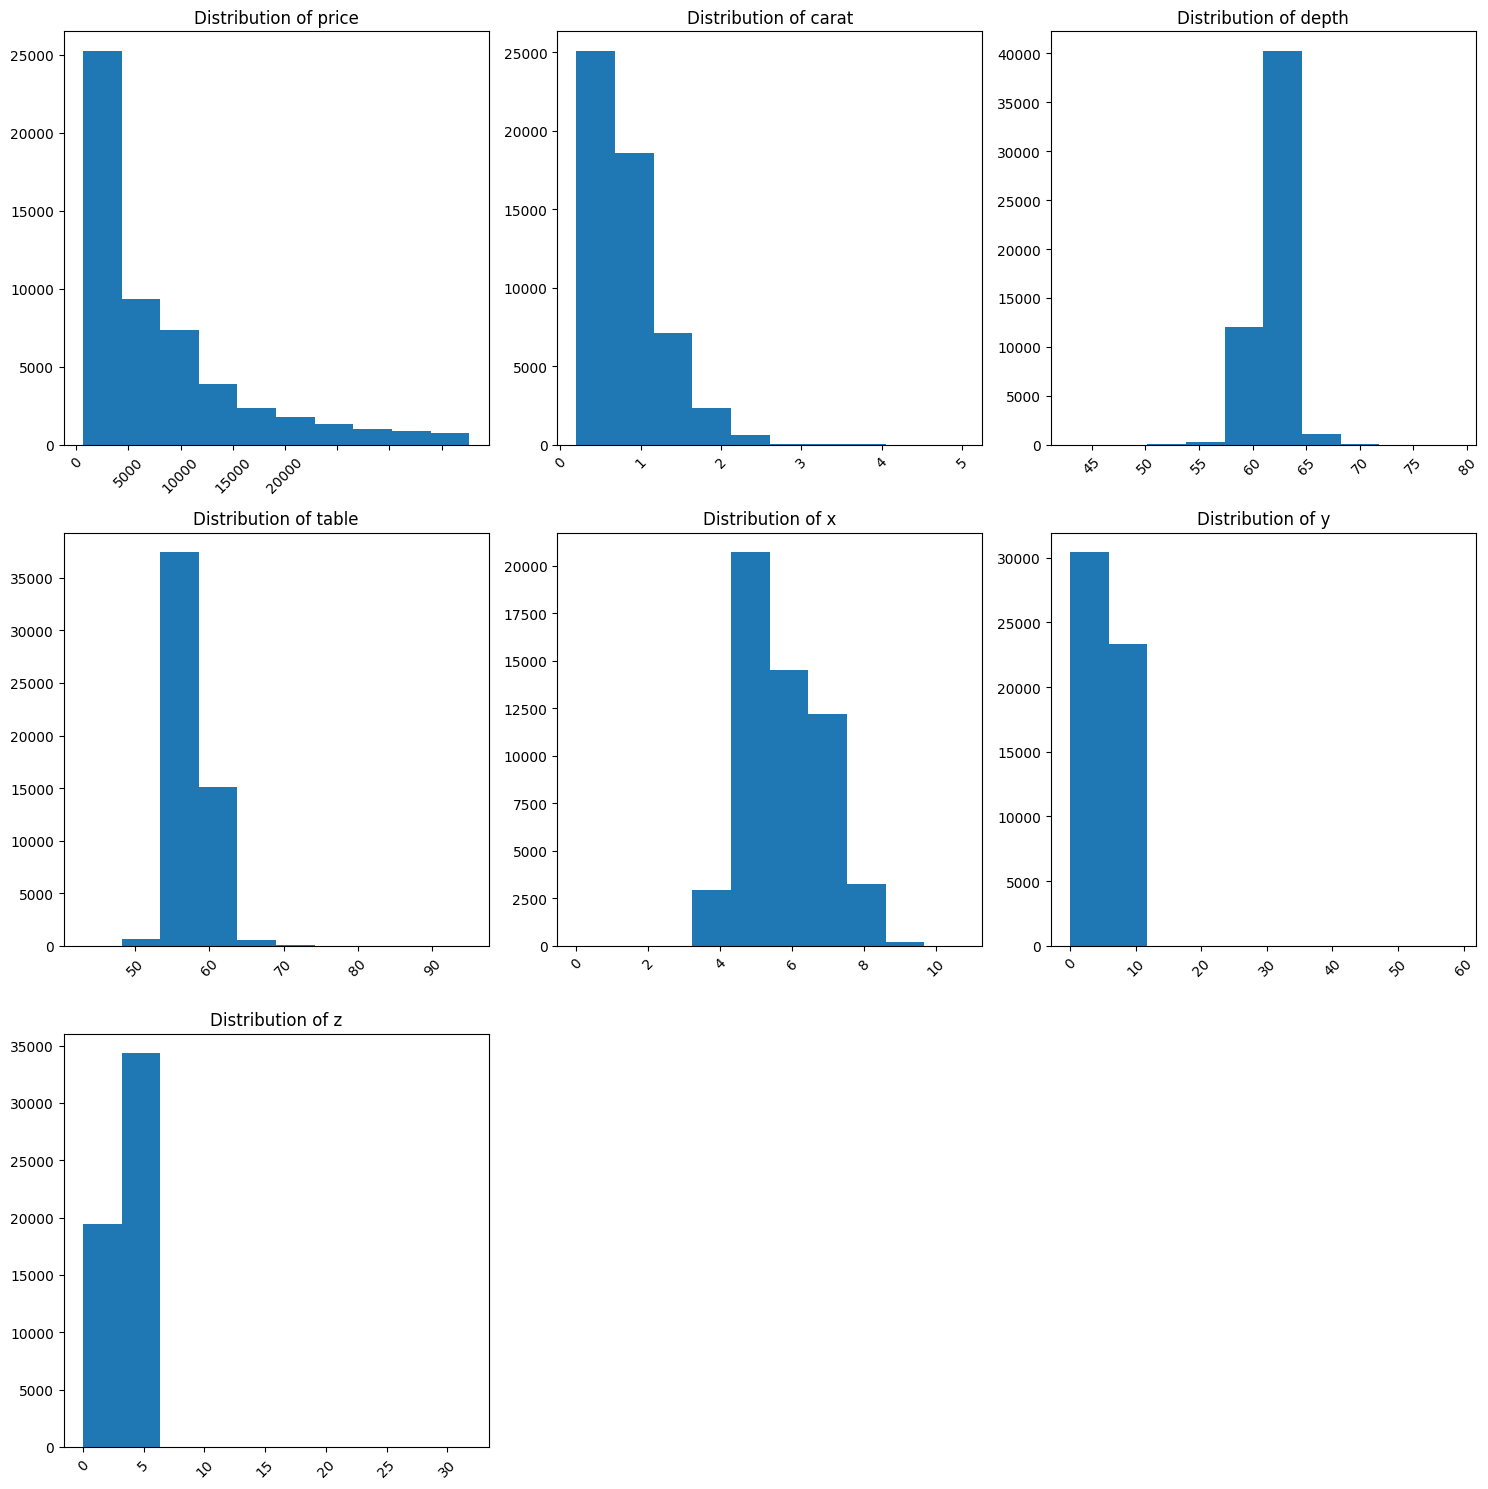
Additionally, it can be for some other cases like the need to see the distribution of a target variable or a single column so we can achieve this through
xxxxxxxxxxdata_cleaner.col_dist("price")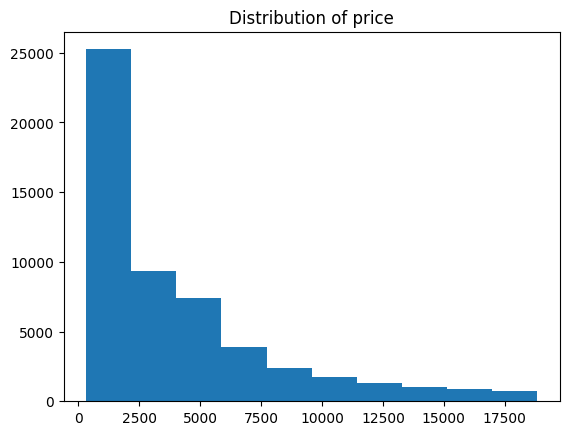
Removing missing values
We primarily employed two methods to handle missing values: dropping and imputing. We opted for these approaches as certain scenarios may necessitate the omission of missing values.
For imputation, we substituted missing values in categorical columns with the most frequently occurring value (mode). Conversely, for continuous data, missing values were replaced with the mean for normalized features and the median for skewed features.
Imputing for missing values
xxxxxxxxxxdata_cleaner.remove_missingvalues()Dropping missing values
This is a dangerous action to take because it deletes all the rows which have missing values but with proof, it can be taken, so if also included it and it can be accessed through the code below
xxxxxxxxxxdata_cleaner.drop_missing_values()Note that both the methods of removing missing values return or print the action that has been taken and also notifies the number of columns that have been dropped.
Then after taking the action, it is better to cross check and see if no missing values are left out by running the vey first code up.
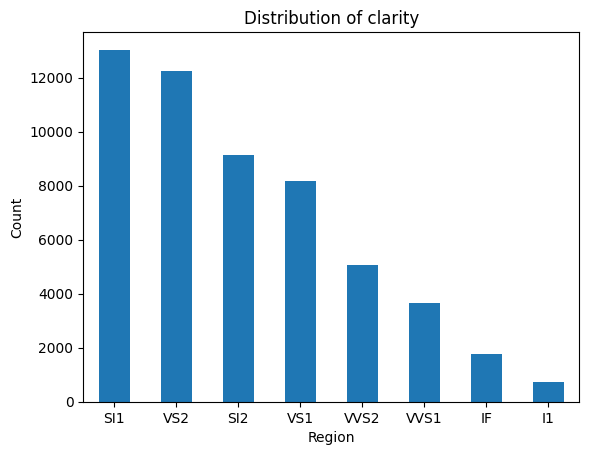
Categorical distributions
Since we have earlier seen the distribution of numeric columns, its also important to view the distribution of categorical columns therefore we can achieve this by
xxxxxxxxxxdata_cleaner.cat_dist()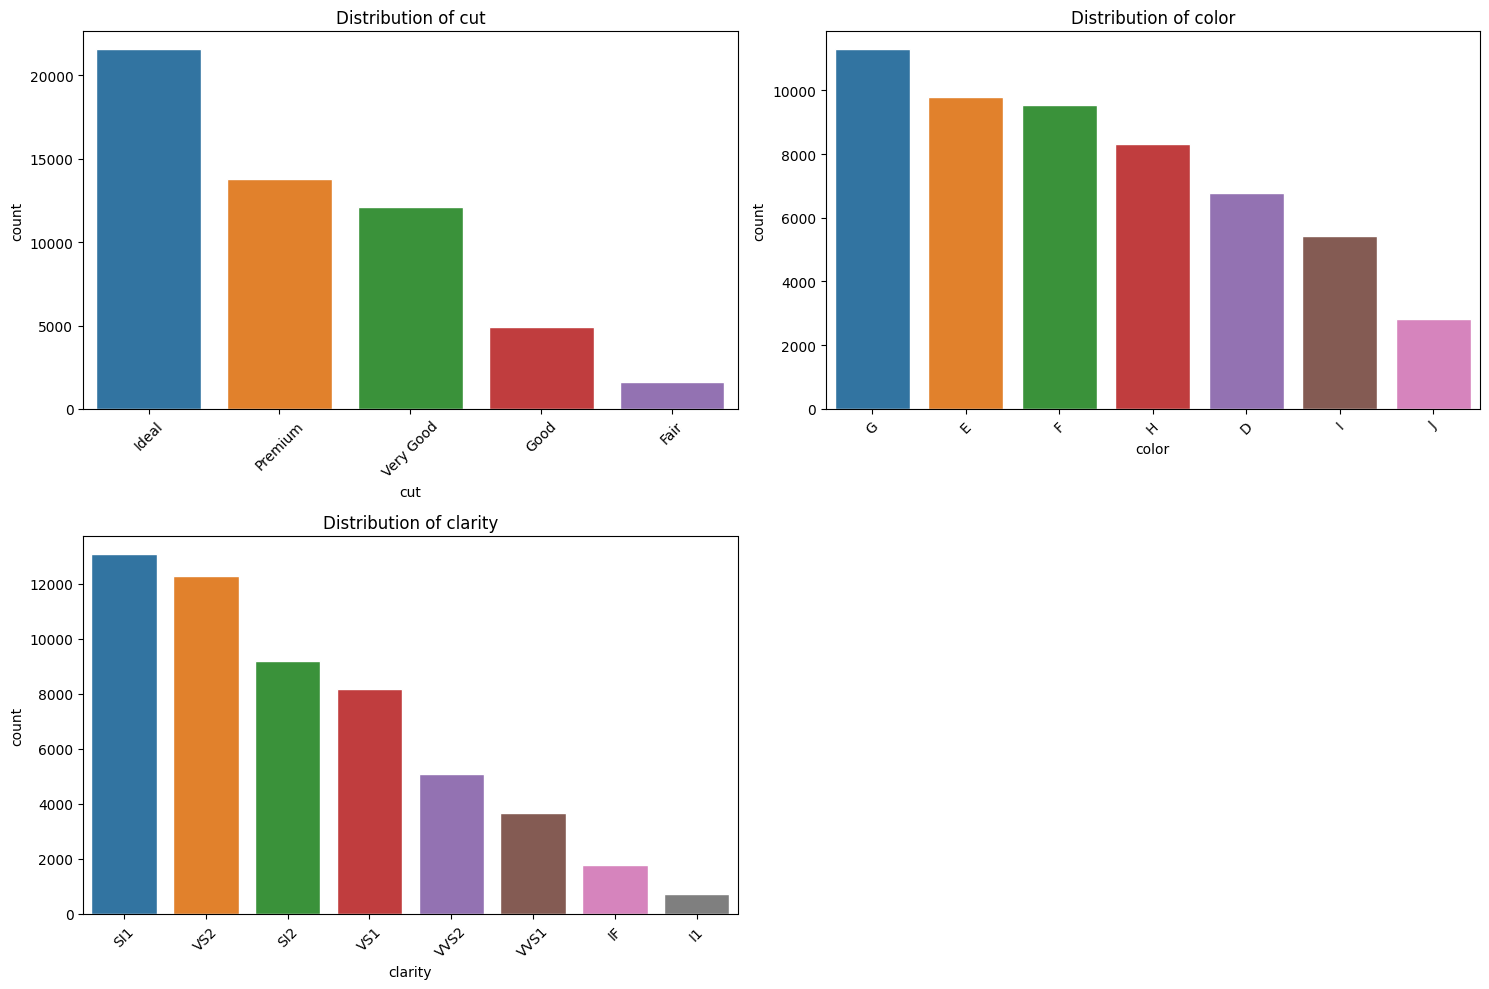
In the same way, if it is a single column from the many that we want to visualize, we can achieve it through
xxxxxxxxxxdata_cleaner.col_cat_dist("clarity")